The screens on this page show made-up figures. Open a demo to click through the real product.
HeyGM

Case study · property and flexible workspace · London

Two buildings, 2,000 desks, and a board pack that writes itself.

A property investor owns two large flexible-workspace buildings in London, run by an operator on site. The asset manager needed one view of occupancy, desk rates, revenue, costs and the deal pipeline, and a pack for the board each month without a week of spreadsheets.

2,000desks
£1mrevenue a month
150k sq ftacross 2 buildings, one portfolio view
9data feeds, each with its own freshness light
1 clickboard pack and asset manager pack
Monthlygross to net, signed off by finance

What was brought together

Accounts, the desk ledger, door access, footfall, the floor plans and the sales pipeline, each refreshed on its own rhythm and each showing how old it is.

Xeromonthly close, debtors, billing
Desk ledgerevery office, who is in it, at what rate
Door accesswho actually comes in
Footfallby day
Floor mapsoffice by office
Leads booklive deals and the pipeline
→
The hub
→
Asset management view
Board PDF
An assistantanswers questions from the data

What the asset manager sees

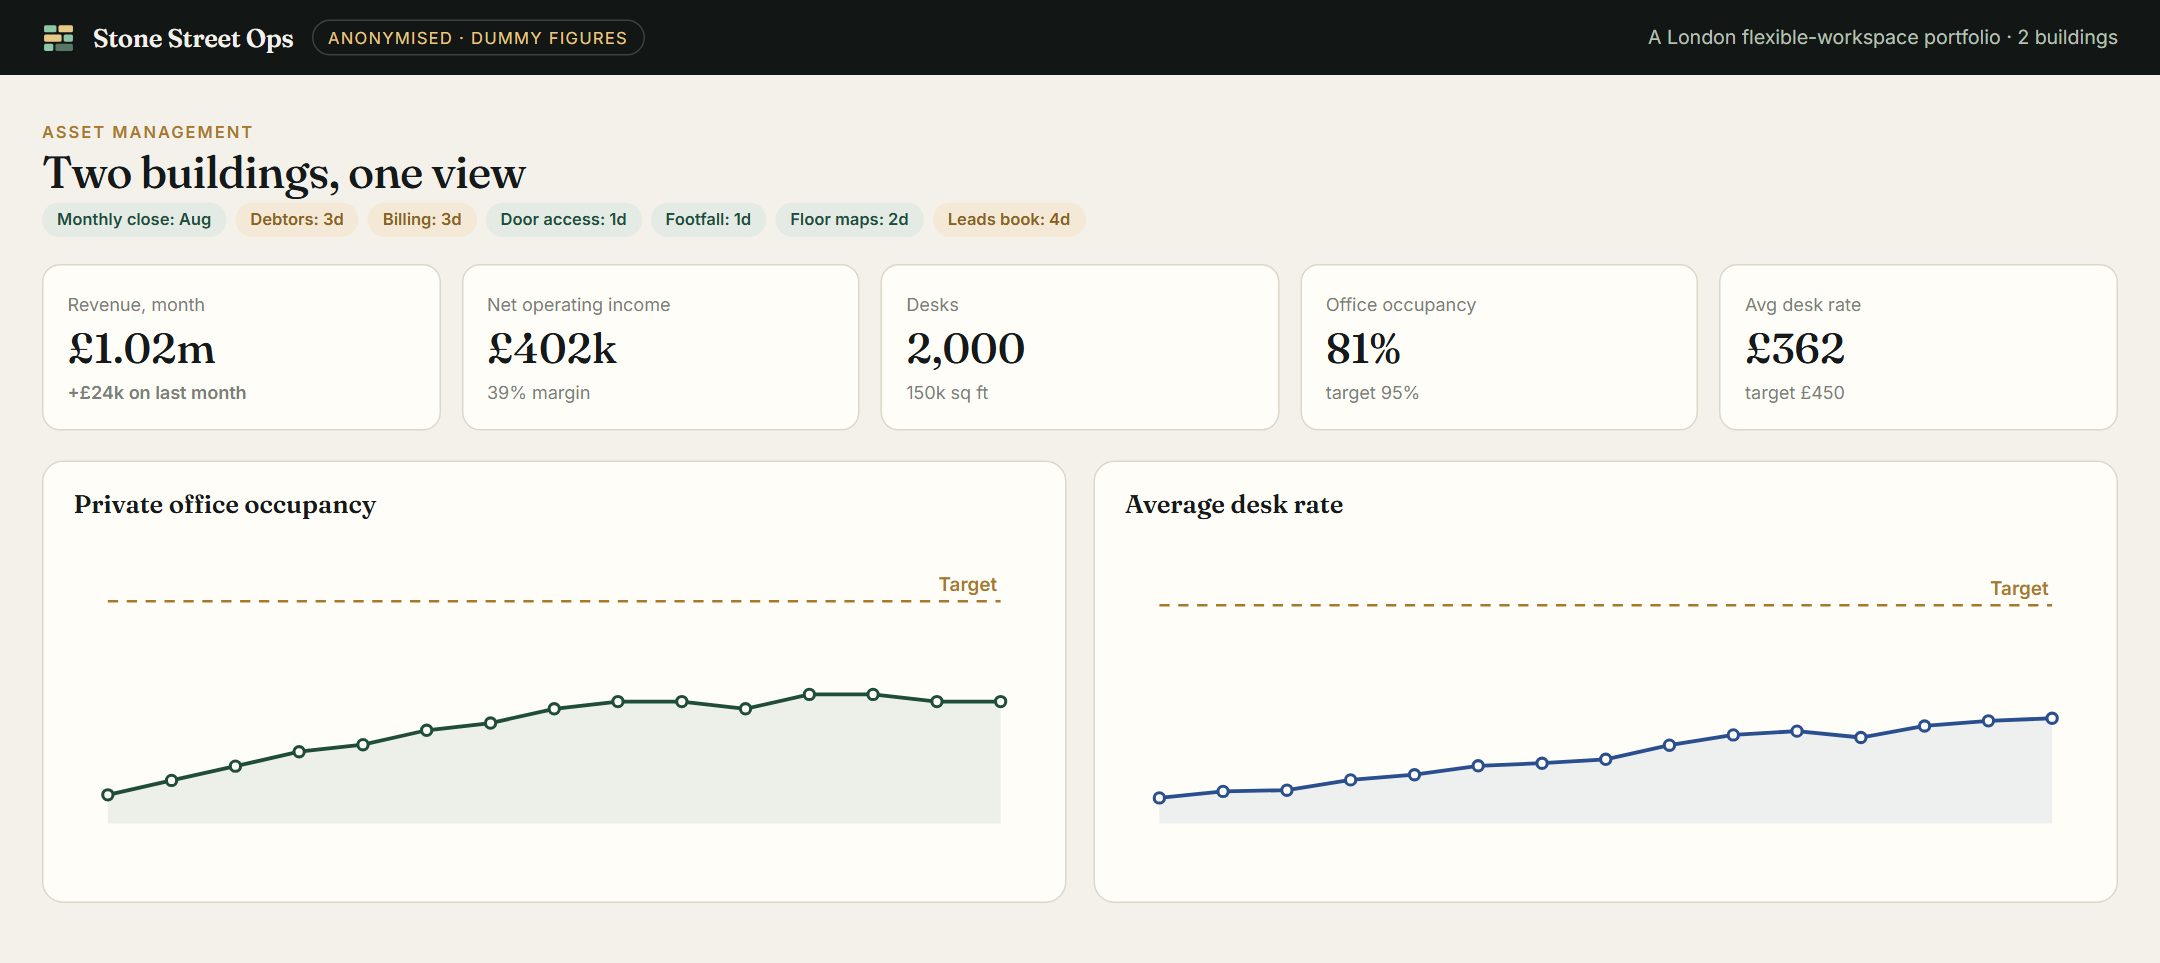
Occupancy and rate, against target

Private offices, dedicated desks and hot desks each tracked against capacity, with the average desk rate against the target rate. Legacy deals that hold the average down are named, with the rate the building would show without them.

Gross to net, every month

Revenue by line, every operating cost as a share of revenue, property costs, net operating income, and actual against budget. One basis throughout, so a step in the chart is a real change and not a change of method.
Desk typeOccupiedDesksAvg rate
Private office
1,215 / 1,500£362
Dedicated desk
27 / 60£295
Hot desk
70 members£180
Target
95%£450
Dummy figures
Trust

Every feed shows its age

A row of lights across the top: accounts closed to which month, debtors three days old, access data five days old. Nobody argues with a number without knowing how fresh it is.

Sales

Live deals beside the empty offices

The pipeline sits next to the vacancy it would fill, with the incremental monthly revenue if the deals land.

Operations

Who pays for a desk and who uses it

Door access against the ledger shows offices that are paid for and empty, and ones that are fuller than their contract.

Finance

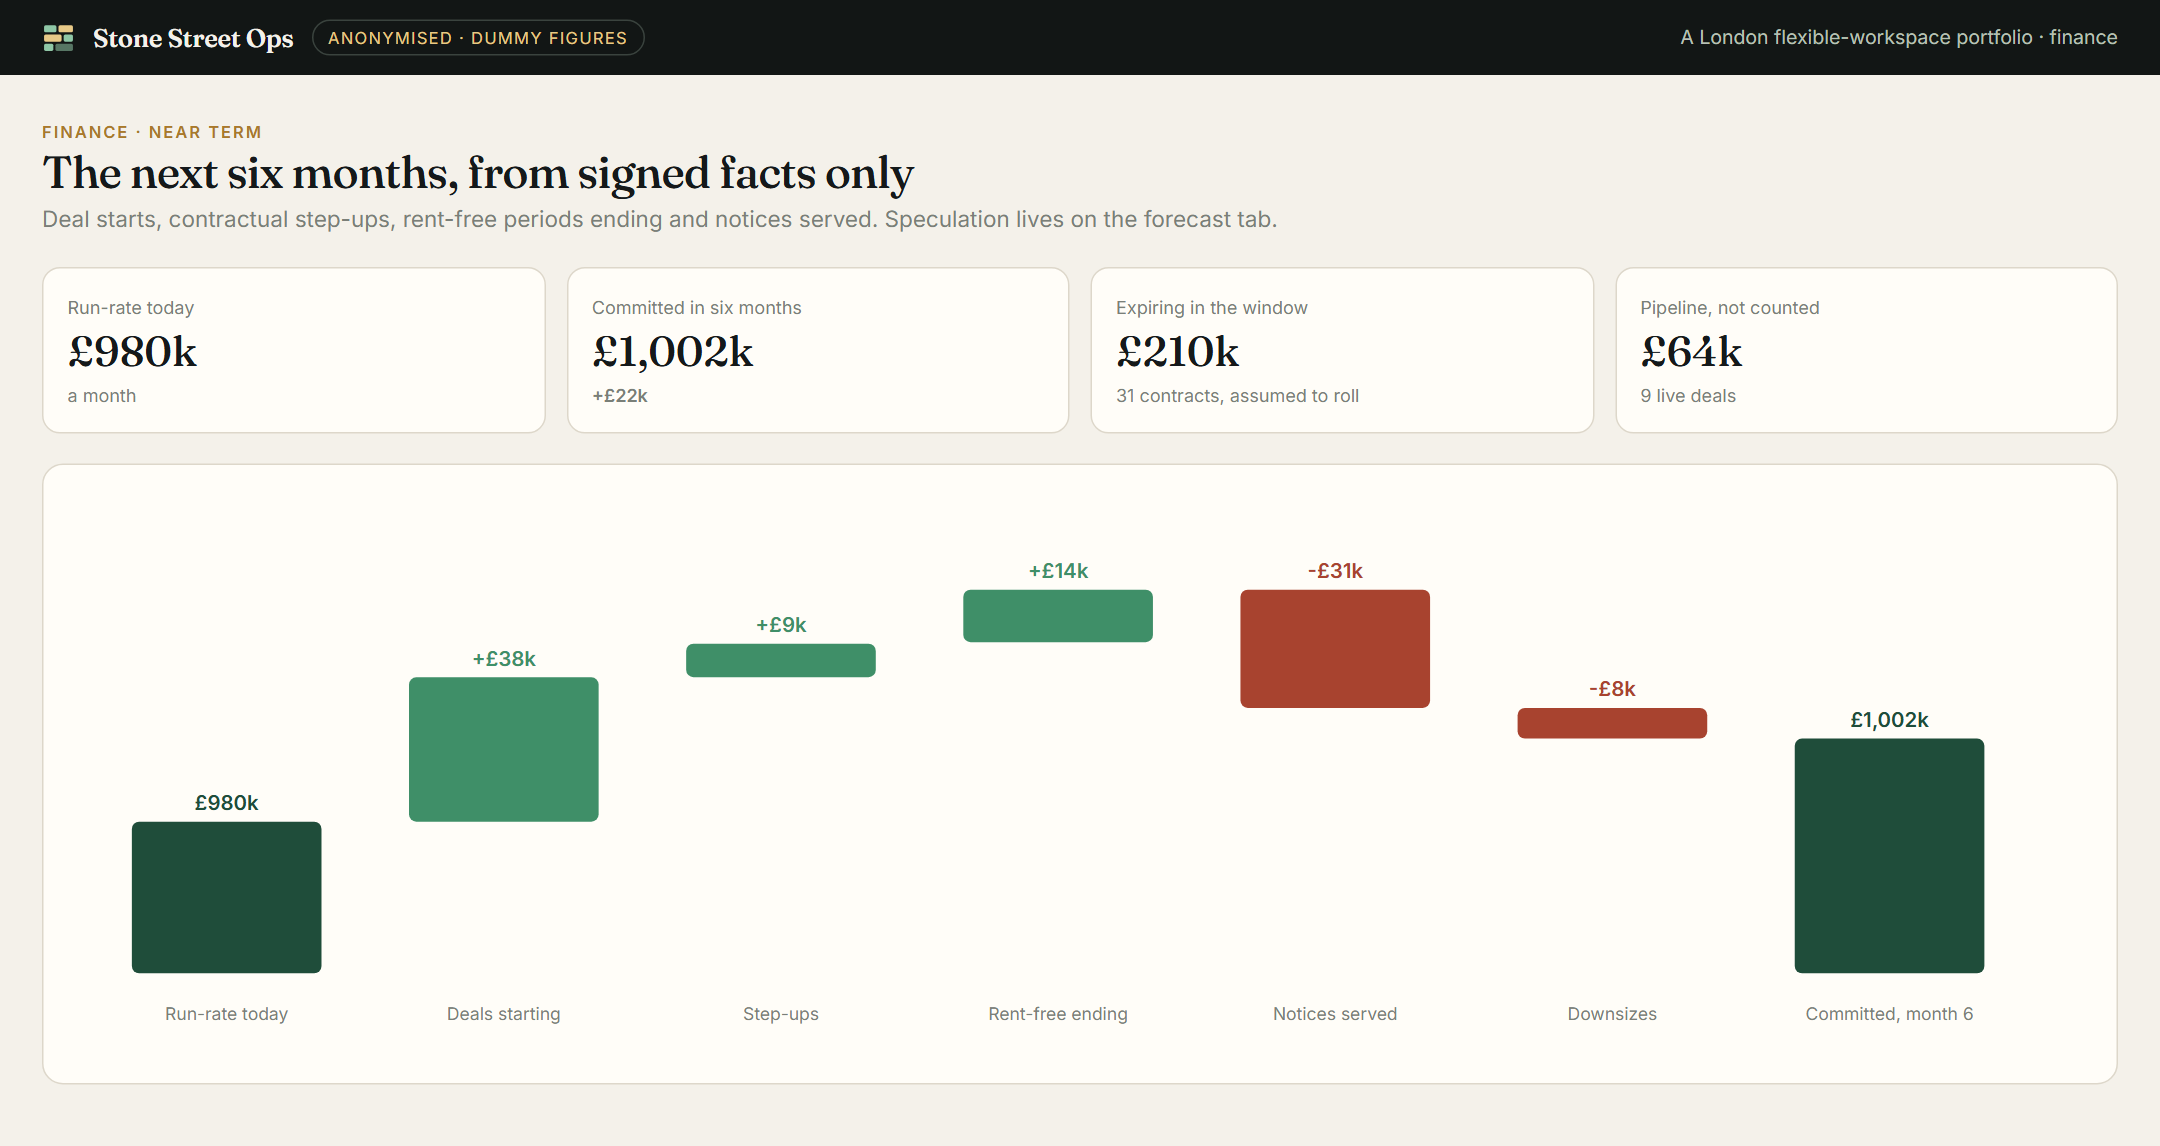
The next six months, from signed facts only

A bridge from today's monthly run-rate to the committed figure in six months: deals starting, contractual step-ups, rent-free periods ending and notices served. Speculation lives on a separate forecast tab.

Debtors

Who owes what, and for how long

Debtors and month-to-date billing come straight from the accounts, so the finance tab and the ledger never disagree.

Reporting

The board pack in one click

The monthly board PDF and the asset manager's pack are made from the same figures as the screen, so they always agree.

See it

Redrawn with dummy figures and no client names. A recording with anonymised data will replace these.

An asset management overview with dummy figures
The overview: freshness lights, the month's numbers, occupancy and desk rate against target.
A six-month committed revenue bridge with dummy figures
Finance: the next six months from signed facts only.

Show me on my numbers.

Thirty minutes. Tell us what your accounts and your bookings are on, and you have your own brief by Friday.

Book the thirty minutes